To make scatter plots with text as points in Base R, we simply need to use plot(), set the scatter points to be white, and then plot the text with text().
# Trick R into not displaying points.
with(mtcars, plot(wt ~ mpg, pch = 1, col = 'white',
                  xlab = 'MPG',
                  ylab = 'Weight',
                  main = 'Weight vs. MPG'))

# Plot the labels on the graph.
with(mtcars, text(mpg, wt, row.names(mtcars),
                  pos = 3, cex=0.0, col = 'cyan4'))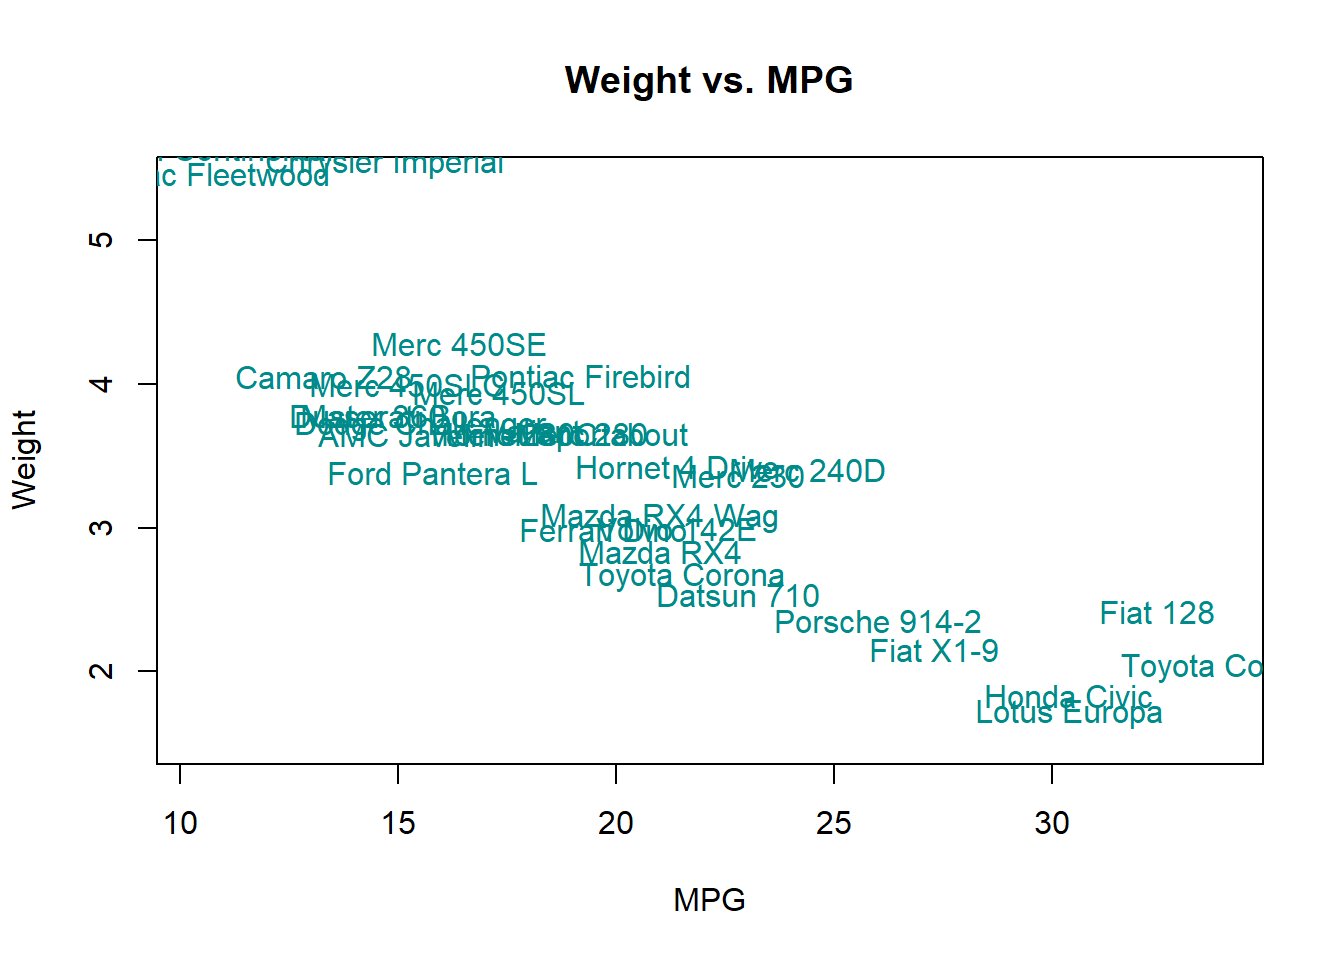
The function plot_text() below generalizes this process:
plot_text <- function(y, x, labels, color = 'cyan4', ...) {

  # Blank out points
  plot(y ~ x, pch = 1, col = 'white', ...)

  # Plot the labels on the graph.
  text(x, y, labels, pos = 3, cex=0.0, col = color)


}
Now, let’s apply it and add average lines with abline().
with(mtcars, plot_text(wt,
                       mpg,
                       row.names(mtcars),
                       color = 'salmon',
                       ylab = 'wt',
                       xlab = 'mpg'))
with(mtcars, abline(h = mean(wt), v = mean(mpg), lty = 2))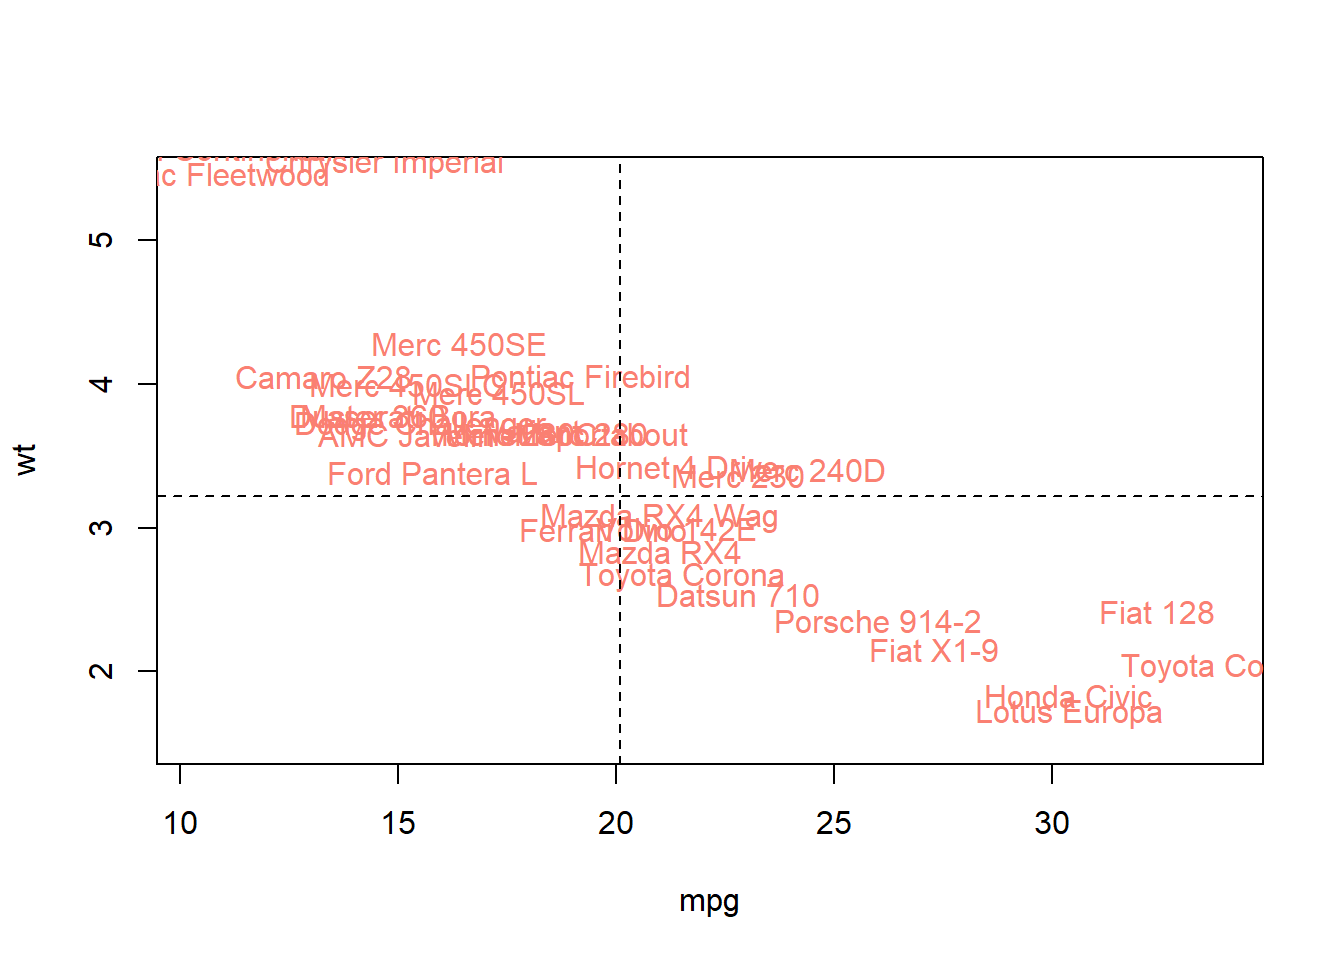
And there you go!
EDIT 2020-03-29
You may also achieve similar results if you set type = 'n' in plot(), which retrospectively makes more sense than just setting the color to be white.1
with(mtcars, plot(wt ~ mpg, pch = 1, type = 'n',
                  xlab = 'MPG',
                  ylab = 'Weight',
                  main = 'Weight vs. MPG'))

# Plot the labels on the graph.
with(mtcars, text(mpg, wt, row.names(mtcars),
                  pos = 3, cex=0.0, col = 'cyan4'))